Ascending Triangle Pattern in Crypto Trading
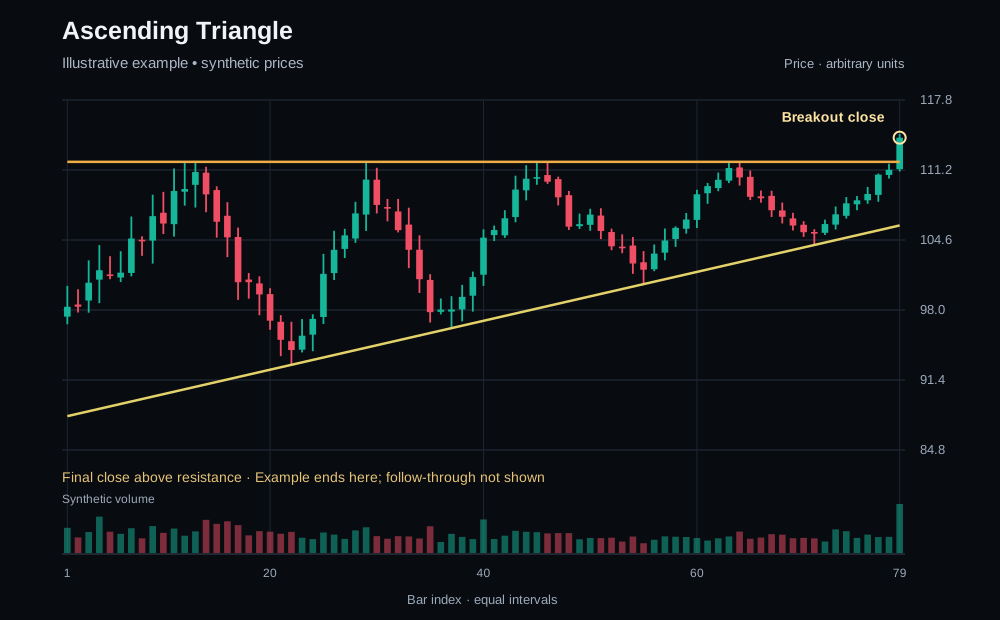
Horizontal resistance above rising support forms a narrowing triangle. Swing highs reach a similar area while swing lows rise.
How to recognize the structure
Connect at least two distinct highs near resistance and two higher lows. Treat these as zones; do not force every wick onto a perfect line.
What the observation means
An upside close beyond resistance is a bullish breakout observation. Rising lows alone do not establish that sellers are exhausted, and a downward break is also possible.
Separate what was visible at the candle close from what happened afterward. A completed formation describes past price action; later candles can support or contradict the initial interpretation.
When the idea fails
A close below rising support contradicts the bullish setup. After an upside break, a return into the triangle warns that the move has not held.
Decide in advance what would invalidate your interpretation. Do not move a planned exit farther away just to keep a setup alive. Gaps, thin liquidity and slippage can cause an exit to fill beyond the intended level.
Volume and market context
Volume can add context, but there is no universal volume sequence that validates this pattern. Compare activity with recent candles on the same exchange and timeframe; spot and derivatives volumes are not interchangeable. Low activity, exchange-specific spikes and changing liquidity can distort comparisons.
Check nearby support and resistance and the broader trend. A cleaner-looking pattern is not a measured chance of a favorable outcome. Multiple indicators can describe the same price movement rather than provide independent evidence.
Separate a higher low from a breakout
Imagine three rallies stopping near the same resistance zone while each pullback ends above the previous low. The rising floor makes an ascending triangle, but price remains inside it until resistance is crossed. A candle that trades above resistance and closes back underneath has tested the boundary without establishing a closing breakout.
After a close above resistance, mark the next pullback separately. Holding above the former ceiling would be additional evidence; falling back inside would challenge the break. Do not count the later retest as information that was already available at the first breakout close.
This is a hypothetical reading exercise, not a historical market example or trading result.
Before considering a trade
- Confirm the pair, exchange, timeframe and candle timing on your own chart.
- Compare the current price with the original formation; a move may already have extended or failed.
- Plan an invalidation level and position size using the loss you can tolerate, including fees and slippage.
- Treat measured moves and nearby levels as scenarios, not promised targets. A recognizable pattern is not by itself a complete entry, stop and target plan.
This guide explains chart-reading conventions, not an investment recommendation. Define your own decision rules before risking capital; a chart illustration does not establish a trading edge.
Related guides
For automatic monitoring, ChartScanner can detect supported patterns and send findings to Telegram.