Bullish Channel Pattern in Crypto Trading
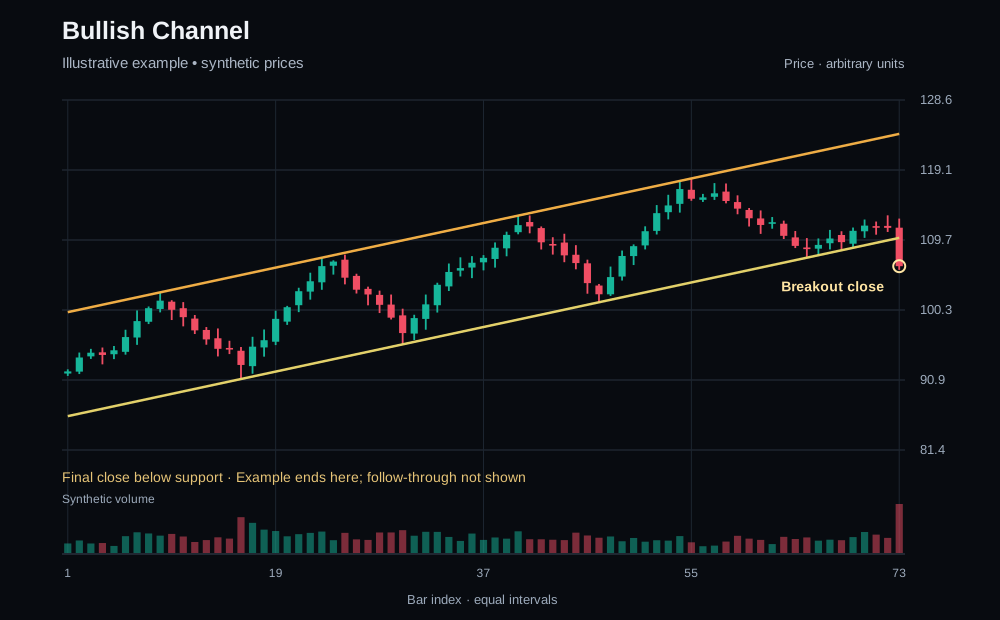
A bullish channel is an upward-sloping price corridor with approximately parallel support and resistance. Higher lows define the lower boundary and higher highs define the upper boundary.
How to recognize the structure
Start with an ascending support line through distinct swing lows, then compare a parallel upper line with swing highs. Converging or diverging boundaries belong to different pattern families.
What the observation means
The word bullish describes the observed uptrend. A lower-boundary bounce, an upside breakout, and a downside break are different events; none follows automatically from the channel shape.
Separate what was visible at the candle close from what happened afterward. A completed formation describes past price action; later candles can support or contradict the initial interpretation.
When the idea fails
A close below channel support challenges the existing uptrend structure. An upside breakout can also fail by returning to the corridor; buying above it is not automatically a better entry.
Decide in advance what would invalidate your interpretation. Do not move a planned exit farther away just to keep a setup alive. Gaps, thin liquidity and slippage can cause an exit to fill beyond the intended level.
Volume and market context
Volume can add context, but there is no universal volume sequence that validates this pattern. Compare activity with recent candles on the same exchange and timeframe; spot and derivatives volumes are not interchangeable. Low activity, exchange-specific spikes and changing liquidity can distort comparisons.
Check nearby support and resistance and the broader trend. A cleaner-looking pattern is not a measured chance of a favorable outcome. Multiple indicators can describe the same price movement rather than provide independent evidence.
Compare a channel bounce with a channel break
Imagine price making higher lows along one ascending line while the highs roughly follow a parallel line above it. A rebound near the lower boundary remains a move within the existing uptrend structure. A close beyond the upper boundary represents a different event: price has left the corridor.
If a later candle closes below the lower boundary, the original channel no longer contains price. Do not widen the channel solely to preserve the bullish interpretation. A fresh structure may develop, but it needs its own anchors and should not overwrite the record of the earlier break.
This is a hypothetical reading exercise, not a historical market example or trading result.
Before considering a trade
- Confirm the pair, exchange, timeframe and candle timing on your own chart.
- Compare the current price with the original formation; a move may already have extended or failed.
- Plan an invalidation level and position size using the loss you can tolerate, including fees and slippage.
- Treat measured moves and nearby levels as scenarios, not promised targets. A recognizable pattern is not by itself a complete entry, stop and target plan.
This guide explains chart-reading conventions, not an investment recommendation. Define your own decision rules before risking capital; a chart illustration does not establish a trading edge.
Related guides
For automatic monitoring, ChartScanner can detect supported patterns and send findings to Telegram.