Evening Star Candlestick Pattern
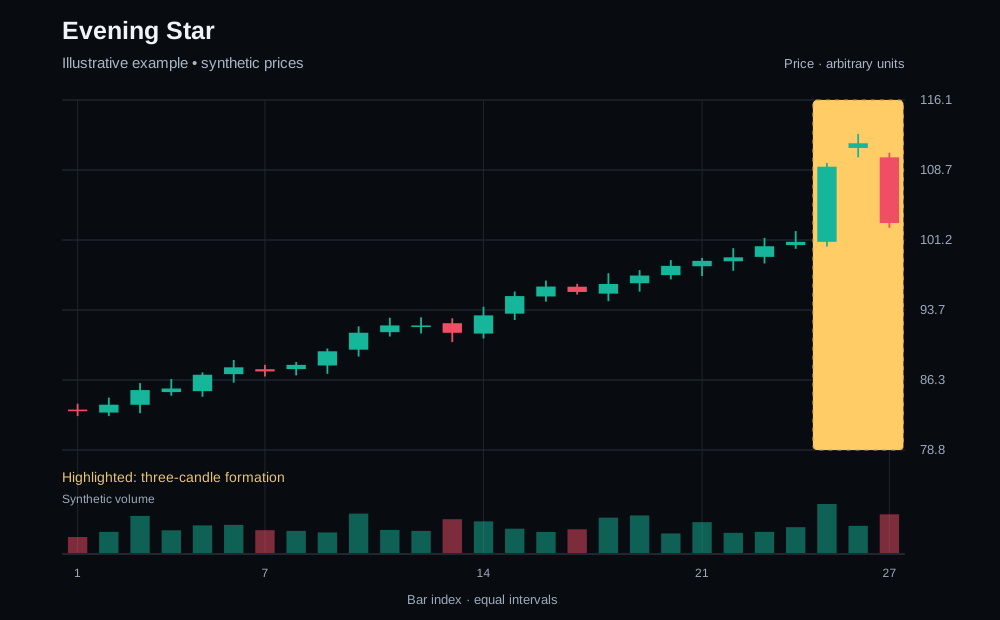
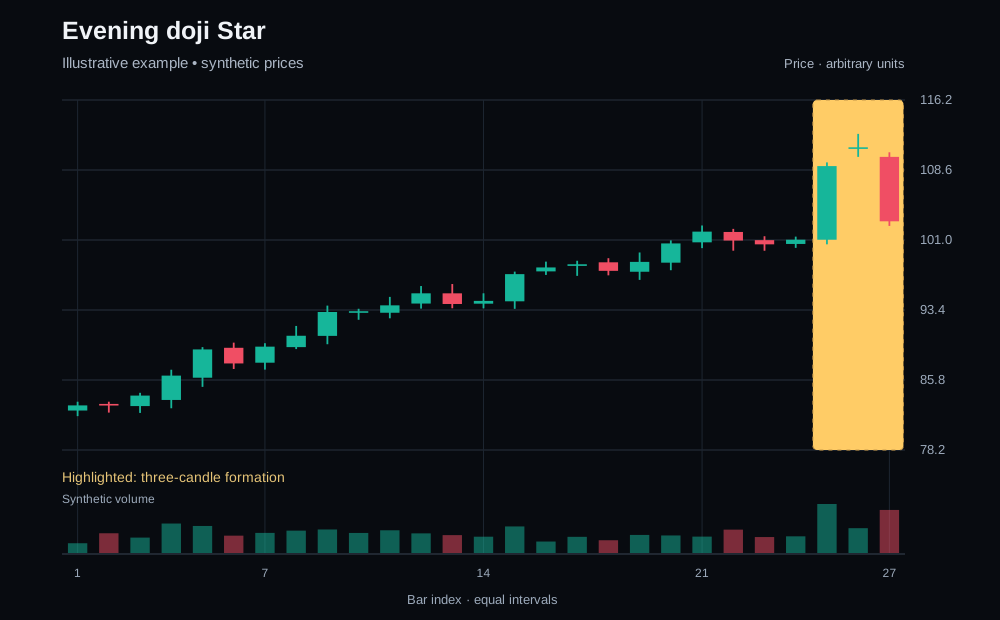
An evening star is a three-candle formation after an advance: a substantial bullish body, a small-bodied middle candle, then a bearish candle closing well into the first candle’s body. In an evening doji star, the middle candle is a doji.
How to recognize the structure
Read all three completed candles in order. A close below the midpoint of the first body is a common textbook criterion. Crypto trades continuously, so classic session-gap definitions may not apply literally.
What the observation means
The sequence records an advance, a pause and a decline. A doji middle candle does not by itself make the bearish interpretation stronger or establish a future outcome.
Separate what was visible at the candle close from what happened afterward. A completed formation describes past price action; later candles can support or contradict the initial interpretation.
When the idea fails
A later break above the formation high challenges the bearish reversal idea. An unfinished third candle can change shape and should not be treated as a completed evening star.
Decide in advance what would invalidate your interpretation. Do not move a planned exit farther away just to keep a setup alive. Gaps, thin liquidity and slippage can cause an exit to fill beyond the intended level.
Volume and market context
Volume can add context, but there is no universal volume sequence that validates this pattern. Compare activity with recent candles on the same exchange and timeframe; spot and derivatives volumes are not interchangeable. Low activity, exchange-specific spikes and changing liquidity can distort comparisons.
Check nearby support and resistance and the broader trend. A cleaner-looking pattern is not a measured chance of a favorable outcome. Multiple indicators can describe the same price movement rather than provide independent evidence.
Do not confirm the pattern on the second candle
Imagine a long bullish candle after an advance, then a small body near the highs. That pause alone is not a completed evening star. The third candle must supply the bearish move back into the first candle’s body under the chosen definition.
An almost equal middle-candle open and close produces the doji variant, not a promise of a larger decline. If the third candle recovers before it closes, the completed sequence may not meet the definition. Record the finished formation before evaluating any later break below its lows or recovery above its highs.
This is a hypothetical reading exercise, not a historical market example or trading result.
Before considering a trade
- Confirm the pair, exchange, timeframe and candle timing on your own chart.
- Compare the current price with the original formation; a move may already have extended or failed.
- Plan an invalidation level and position size using the loss you can tolerate, including fees and slippage.
- Treat measured moves and nearby levels as scenarios, not promised targets. A recognizable pattern is not by itself a complete entry, stop and target plan.
This guide explains chart-reading conventions, not an investment recommendation. Define your own decision rules before risking capital; a chart illustration does not establish a trading edge.
Related guides
For automatic monitoring, ChartScanner can detect supported patterns and send findings to Telegram.